Aggregate utilities.
Statistician-grade output.
A plain-English name for the statistical heavy lifting your analyst would otherwise run by hand: Fieldbase fits an aggregate multinomial-logit model to your conjoint, zero-centres the part-worths within each attribute, and lays the whole thing out beside the design and the data. Every level gets its own utility, its own bar, and its own t-stat. Attribute importance falls out of the utility ranges — no manual calculation, no spreadsheet.
Importance up top, part-worths underneath.
The whole report on one page — one line per level, read it top-to-bottom.
Attribute importance bars across the top, so a brand team can read the hierarchy in two seconds. Per-level tables underneath, with utility, part-worth bar (green positive, red negative), and t-stat on the right so a stats-reader can call significance without opening a second tool. The outside-option constant for the None tile is called out at the bottom.
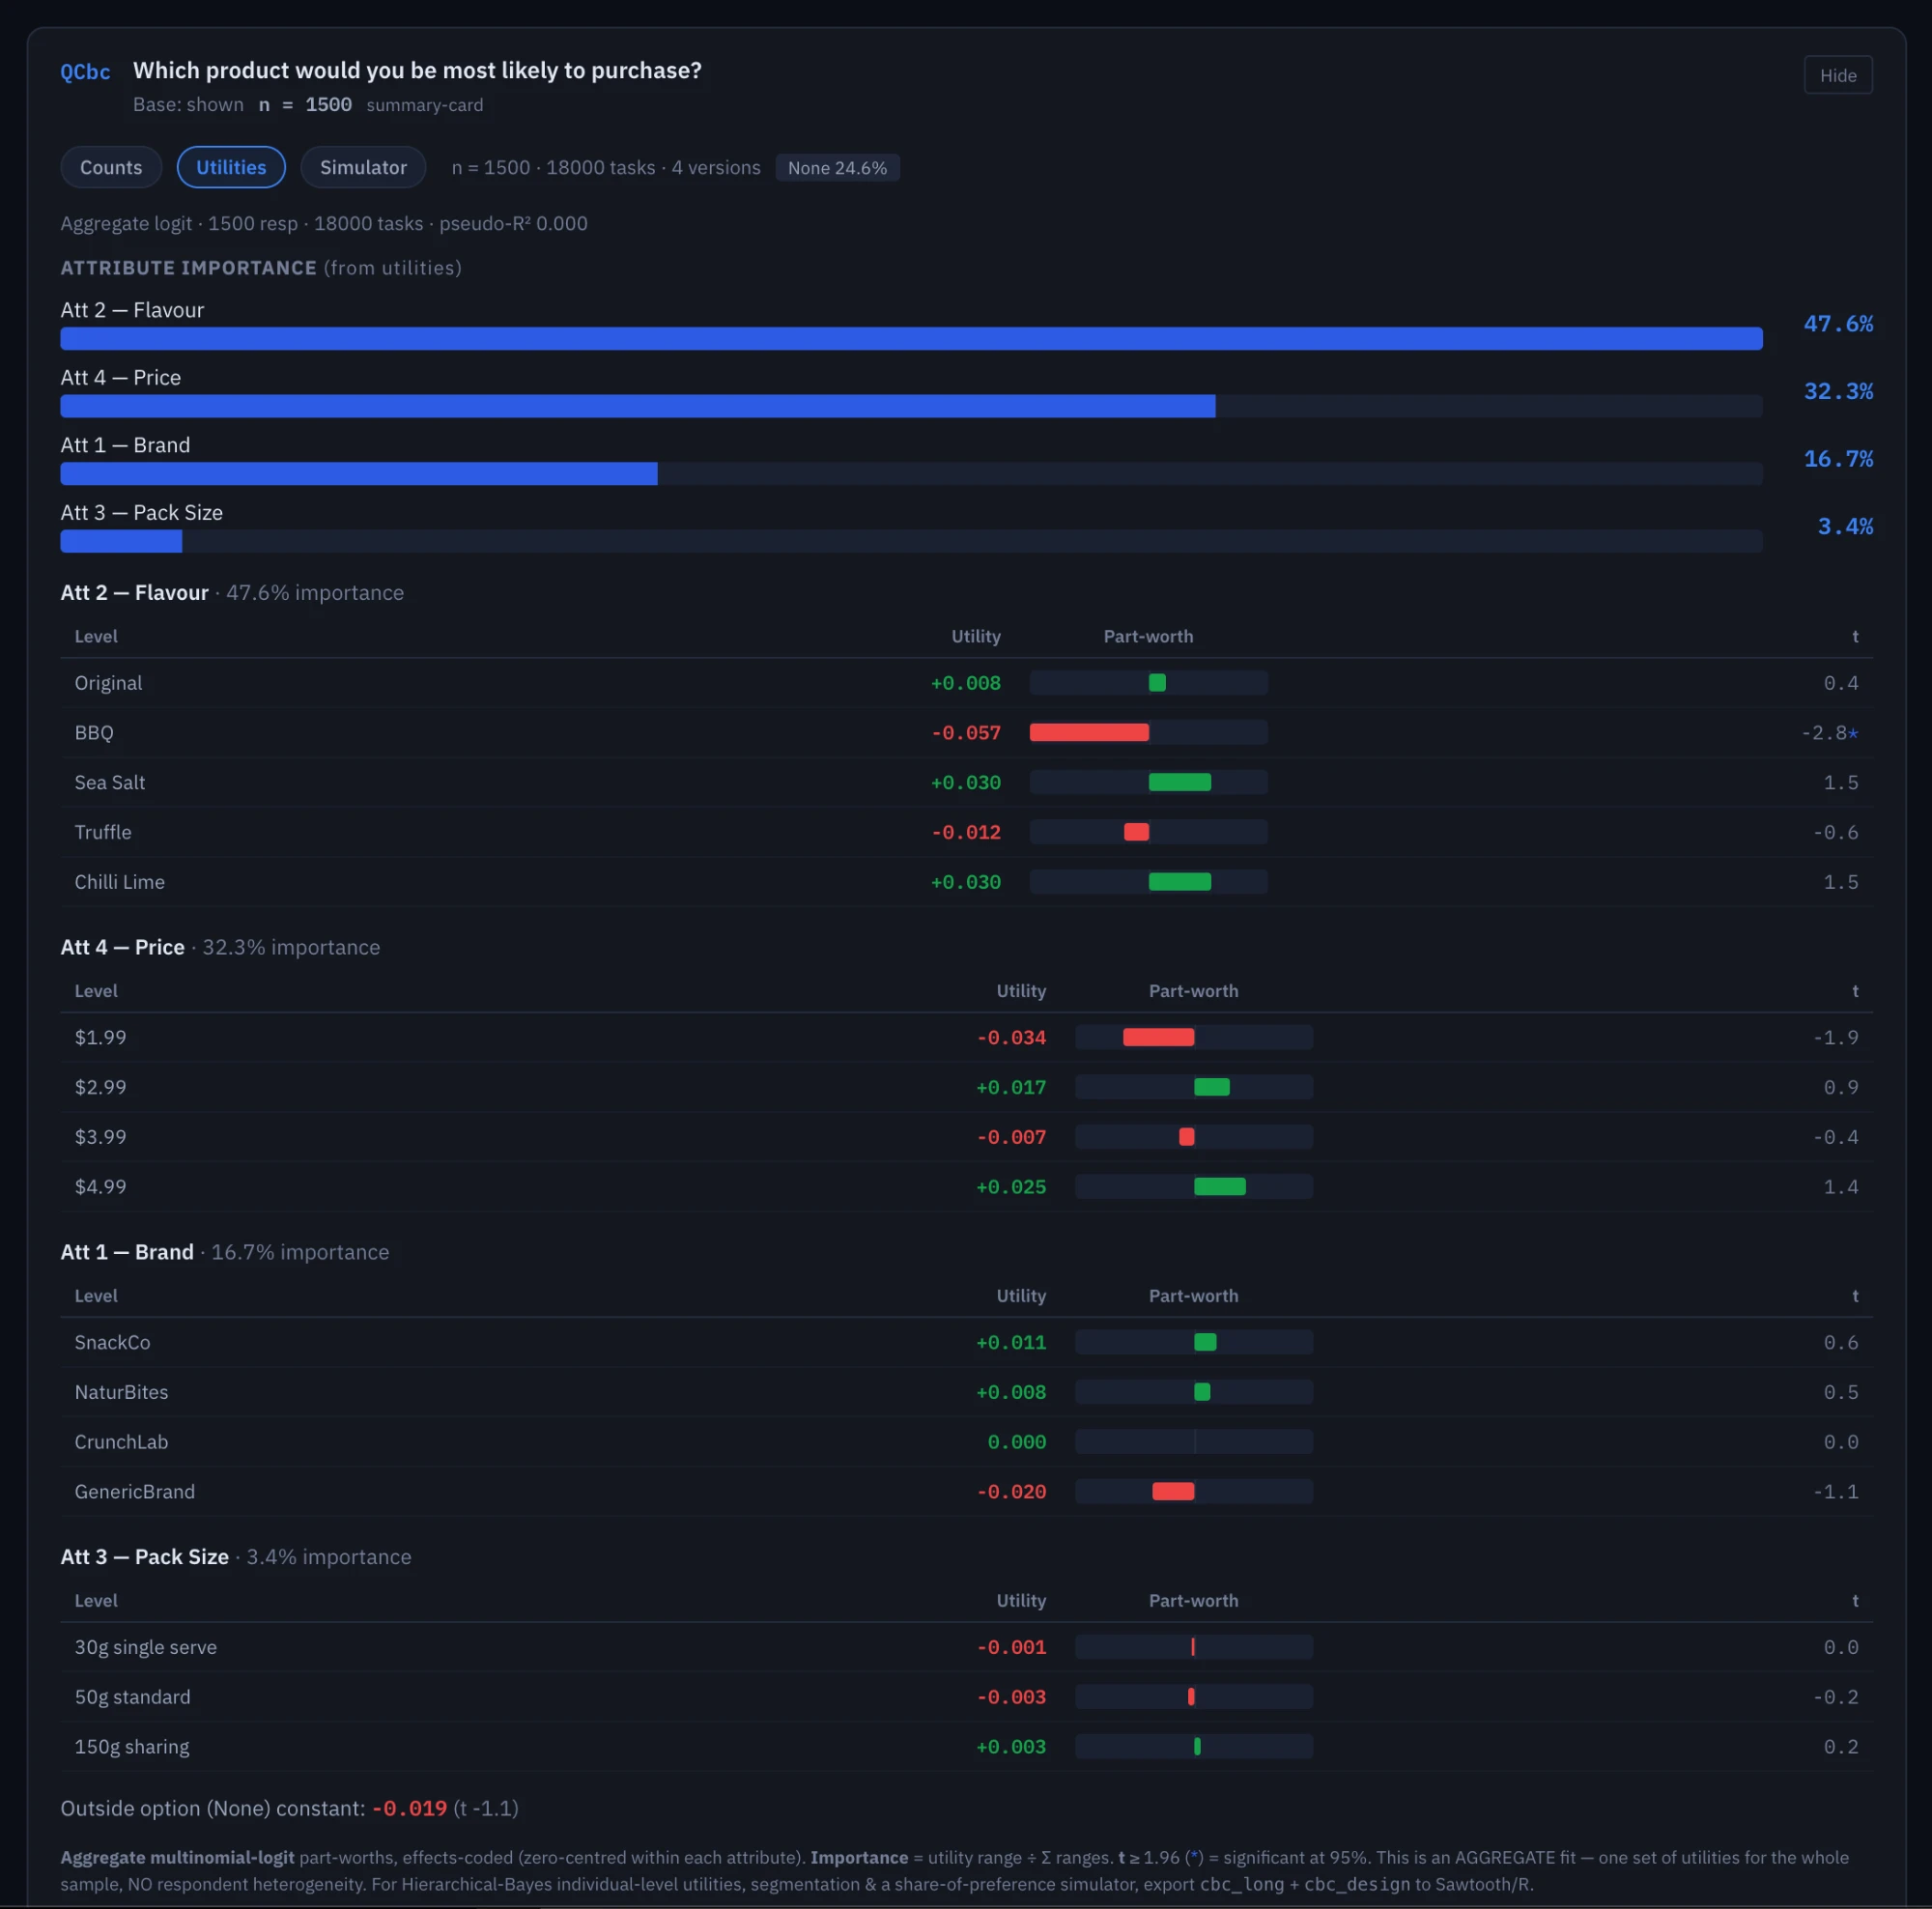
Four columns do the work.
What each column means, and what to read first.
Analysts read the t-stat column first to know what to trust. Non-analysts read the importance bars first to know what matters. Both work from the same table — nothing hidden, no second view to flip to.
- Utility. The level's zero-centred part-worth within its attribute. Positive means more preferred than average for that attribute; zero is the attribute's mean.
- Part-worth bar. A visual read on the magnitude — green for positive, red for negative. Lets a brand team scan a table of 20 levels and spot the shape in a glance.
- t-stat. How confident the coefficient is. t ≥ 1.96 is 95% significant; a star next to it calls it out so you don't have to count decimals.
- Importance. The attribute's utility range divided by the sum of ranges, normalised to 100% across the model. The bars at the top of the report.
- Outside-option constant. The utility of the None tile, when one is in the task. A big negative constant means respondents genuinely wanted to buy; a positive one means None was a popular escape.
For HB, the raw data is one click away.
Aggregate is honest about what it is. For individual-level utilities and segment work, hand the data to your statistician.
Fieldbase ships the aggregate fit because it covers 80% of
the questions a brand team actually asks of a conjoint:
what levels won, by how much, and whether that result is
trustworthy. For the other 20% — latent class segmentation,
individual-level draws, realistic substitution patterns —
your statistician wants Hierarchical Bayes. The raw
cbc_long dataset and the cbc_design
file export in one click, ready for Sawtooth, R, or Python.
cbc_long chosen 0/1, none flag. Exactly what every CBC fitter expects as input.cbc_design bayesm/ChoiceModelR, or Python's pyLogit. No reshape, no column juggling.The analyst-grade output your brand team never sees because it's buried in a PowerPoint
Aggregate utilities on Fieldbase live next to the design, next to the data, next to the simulator. One click to the raw dataset for Hierarchical Bayes, one hop to the share simulator for what-if conversations. The report is honest about what it is — an aggregate fit, no respondent heterogeneity — and the thing it isn't tells you exactly where to go next.